In previous blogs we had already worked with Drill Down and Drill Up using Parameter Actions. In those exercises, the definition of the menu for Drill Up was achieved using several sheets for the menu, one for each Drill Up option required.
In this blog I will share a new technique to present Drill Up options using a single sheet.
What do we use Drill Down and Drill Up for?
The Drill Down is a very useful tool for queries since it allows the user to go from the general to the specific. When we use a Drill Down menu, we navigate in a hierarchy of dimensions or levels from the upper to the lower dimension, by selecting one of the values of the presented dimension.
As for Drill Up, implies going from the specific to the general: When using a Drill Up Menu, we navigate to higher dimensions of a hierarchy with the difference that the jumps in the levels can be abrupt; we can select any dimension of the deployed.
Drill Down and Drill Up has multiple uses, for example with accounting, financial, inventory, portfolio, or other data, since it allows, from a visualized information, to “immerse” in that information in order to know the detail of the data that has been used to create it.
In my case, where I have worked with financial information for quite some time, I have seen that when a figure goes out of its normal range, or on the one hand, there is a need to understand what caused this deviation; or on the other hand, the person distrusts the numbers, therefore, being able to use a tool that helps in traceability, to know where the information comes from, gives us greater understanding, credibility and confidence when analyzing and submit information.
Requirements:
- Use Orders from Tableau superstore dataset 2019.4.
- The dimensions Region, State, City and Postal Code will be used for the navigation of Drill Down and Drill Up.
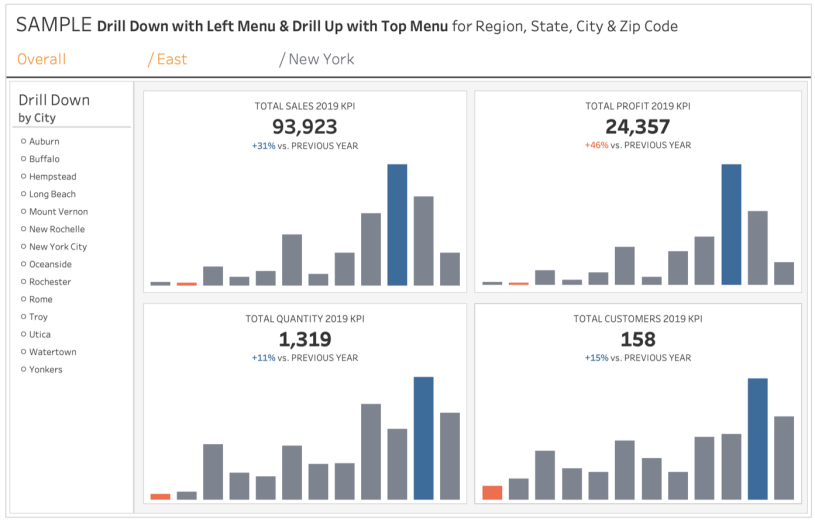
- On the left side, you will have a Drill Down menu in a single sheet, where the values of the next level of the hierarchy will be displayed, from which one of the options can be selected.
- At the top, there will be a single sheet menu, where one to five levels of Drill Up will be displayed. This menu will help us: 1) To indicate the values of the current hierarchy as a heading; and 2) To allow the user to select any of the options in the upper levels of the hierarchy, to return the query directly to the desired level.
- In the central part, the main graph(s) will be located.
Next, I share the steps to be followed to meet these requirements.
STEP 1. CREATE PARAMETERS.
For this exercise it needs only two parameters. These parameters are shared and updated by both menus.
| PARAMETER | TYPE | CURRENT VALUE | ALLOWABLE VALUES |
| Level | Integer | 0 | All |
| Path | String | Overall | All |
For the initial value of the “Path” I used the description “Overall” to indicate the starting point in the Drill Down of the hierarchy, however, any other description can be used, such as: “Home”, “Total “, or “United States”.
In case you decide to use another description, you only have to replace the “Overall” string in the formulas, with the new description.
DEFINITIONS FOR DRILL DOWN
STEP 2. CALCULATE THE DIMENSIONS THAT WILL SUPPORT US WITH THE DRILL DOWN.
Five levels of Drill Down will be handled: Region, State, City, Zip Code and Return to Overall. Thus, a level for each dimension has to be included in the Drill Down, plus an additional level to present the option to close the current drill down cycle and reset with a new one.
The Postal Code field by default is considered as numerical, so it’s required to change its data type to a string and thus match the type of data handled in the rest of the hierarchy values.
The “DD Level” and “DD Path” dimensions will help us to update the parameters defined in step 1 and the “DD Label” dimension will have the value of the visible legend of the menu for the user to identify the Drill Down option desired.
| DD Level | IIF([Level] = 4, 0, [Level] + 1) |
| DD Label | CASE [Level] WHEN 0 THEN [Region] WHEN 1 THEN [State] WHEN 2 THEN [City] WHEN 3 THEN [Postal Code] WHEN 4 THEN “Overall” END |
| DD Path | IIF([Level] = 4, “Overall”, [Path] + “/” + [DD Label]) |
Convert the “DD Level” field to dimension with the right click or just drag it to the dimensions.
I used for the last level of “DD Label”, the description of “Overall”, however, it could be replaced by the value of the last field in the hierarchy, depending on which one best suits what you want to show.
The following definition is to select or filter from Superstore the records that meet the Drill Down user selections set to the Path value.
Update: 06/16/2020
Compact formula:
| DD Filter | CONTAINS(“Overall/” + [Region] + “/” + [State] + “/” + [City] + “/” + [Postal Code], [Path]) |
Original formula:
| DD Filter | ([Region] = SPLIT([Path], “/”, 2) OR SPLIT([Path], “/”, 2) = “”) AND ([State] = SPLIT([Path], “/”, 3) OR SPLIT([Path], “/”, 3) = “”) AND ([City] = SPLIT([Path], “/”, 4) OR SPLIT([Path], “/”, 4) = “”) AND ([Postal Code] = SPLIT([Path], “/”, 5) OR SPLIT([Path], “/”, 5) = “”) |
End of update
Finally, we will calculate the legend of the title and subtitle for the heading of the Drill Down menu.
| DD Title | IIF([Level] < 4, “Drill Down “, “”) |
| DD Subtitle | CASE [Level] WHEN 0 THEN “by Region” WHEN 1 THEN “by State” WHEN 2 THEN “by City” WHEN 3 THEN “by Zip Code” WHEN 4 THEN “Return to” END |
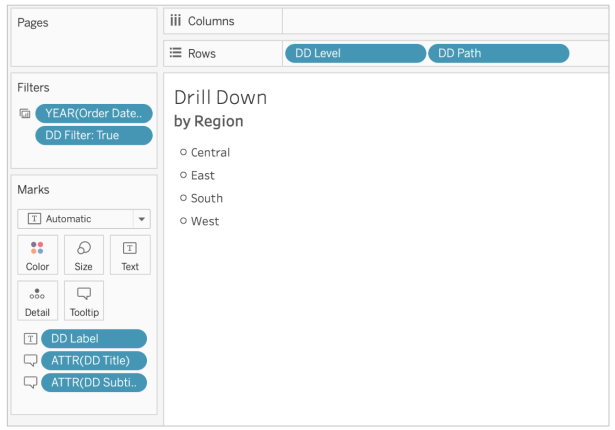
STEP 3. CREATE THE SHEET FOR THE DRILL DOWN MENU.
Move to the shelves of:
- Filters ⬅ Year of Order Date = 2019
- Filters ⬅ “DD Filter” = TRUE
- Rows ⬅ “DD Level” and “DD Path”
- Text ⬅ “DD Label”
- Tooltips ⬅ “DD Title” and “DD Subtitle”
The “DD Level” and “DD Path” fields must be hidden, for which, the field must be selected with the right click and deselect the “Show Header” option.
The “DD Title” and “DD Subtitle” fields will be used to define the sheet header.
Adjust colors and formats.
DEFINITIONS FOR DRILL UP
STEP 4. CALCULATE THE DIMENSION TO PRESENT DRILL UP MENU OPTIONS.
Up to 5 levels of Drill Up will be handled: Overall, Region, State, City and Zip Code. That is one level for each level of Drill Down that has been navigated in the hierarchy of dimensions, plus an additional level with the option to return to the “Overall”.
As we don’t have in Superstore a dimension with such values, we apply a small trick, which consists in creating the new dimension from another field, although there is no relationship between the new created dimension and the original dimension. In this exercise we will use the Order Date dimension to create the new dimension.
| DU Level | INT([Order Date]) % 5 |
Convert “DU Level” to dimension with the right click or just drag it to the dimensions.
The formula described here calculates the residual of dividing the numerical value of the date of the “Order Date” field by 5, giving possible values as numbers between 0 and 4. That is, we are arbitrarily grouping the days into five groups (0, 1, 2, 3, 4), one for each required value for the new dimension or menu options required.
Update: 07/13/2020
If your data doesn’t have a date field, don’t worry, since it’s possible to use any other dimension, including any of the dimensions of the hierarchy with which you are going to work, the only requirement is that the original dimension has at least as many different values, such as what is required for the Drill Up menu (in this case, at least 5 different values). You can also use another type of formula to create the new dimension, for example, the Case () function could be useful for you.
End Update
This technique is known as “Internal Data Densification” and as we had already seen in the start of the year post “How to order Asc / Desc by a Dimension or Measurement with Parameter Actions” it is a very useful tool for defining menus where options are not defined in the data source. Make sure to check, whether the selected field from the data (here based on Order Date) gives back a valid new dimension with the required number of members.
Unlike the exercise carried out in the previous blog, where the options and the menu legends were fixed, since each menu option was assigned a unique name of measures or dimension, the definition of the menu in this new exercise is quite dynamic, since both the amount of options to be presented, as well as the legends have been displayed, will vary and depend on the user’s previous selections.
STEP 5. CALCULATE THE REST OF THE DIMENSIONS THAT WILL SUPPORT US WITH THE DRILL UP.
Once the “DU Level” dimension has been defined under the Internal Data Densification technique, we will calculate the rest of the dimensions required for the Drill Up.
Each of the new dimensions will be determined by the respective value of the “DU Level” dimension and the values of the parameters, whose value is determined by the decisions made by the user.
Update: 06/16/2020
Compact formula:
| DU Path | LEFT([Path], FINDNTH([Path] + “/”, “/”, [DU Level] + 1) – 1) |
Original formula:
| DU Path | “Overall” + IIF([DU Level] >= 1, “/” + SPLIT([Path], “/”, 2), “”) + IIF([DU Level] >= 2, “/” + SPLIT([Path], “/”, 3), “”) + IIF([DU Level] >= 3, “/” + SPLIT([Path], “/”, 4), “”) + IIF([DU Level] >= 4, “/” + SPLIT([Path], “/”, 5), “”) |
End of update
Update: 06/29/2020
Compact formula:
| DU Label | IIF([DU Level] = 0, “”, “/”) + SPLIT([DU Path], “/”, -1) |
Original formula:
| DU Label | CASE [DU Level] WHEN 0 THEN “Overall” WHEN 1 THEN “/” + SPLIT([Path], “/”, 2) WHEN 2 THEN “/” + SPLIT([Path], “/”, 3) WHEN 3 THEN “/” + SPLIT([Path], “/”, 4) WHEN 4 THEN “/” + SPLIT([Path], “/”, 5) END |
End of update
The “DU Level” and “DU Path” dimensions will be used to update the parameters defined in step 1. The “DU Label” dimension will contain the visible menu legend for the user to select the desired Drill Up option.
To finish the definitions for the Drill Up, a filter is required to select the levels of the Drill Up menu that will be visible and the color definition of the menu options that will allow us to distinguish the last level used, from the upper levels in the hierarchy.
| DU Filter | [DU Level] <= [Level] |
| DU Color | [DU Level] = [Level] |
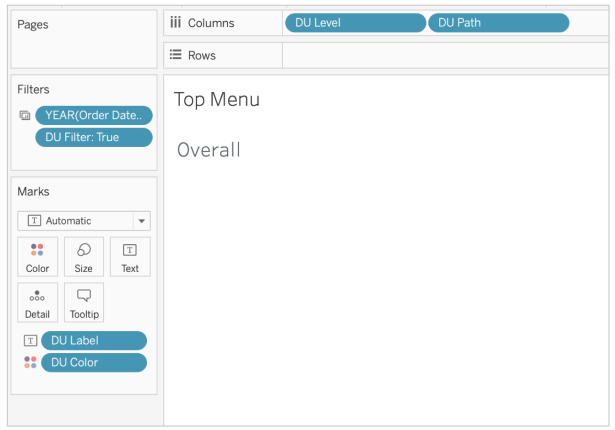
STEP 6. CREATE THE SHEET FOR THE UPPER MENU OF THE DRILL UP.
Move to shelves of:
- Filters ⬅ Year of Order Date = 2019
- Filters ⬅ “DU Filter” = TRUE
- Columns ⬅ “DU Level” and “DU Path”
- Text ⬅ “DU Label”
- Color ⬅ “DU Color”
The “DU Level” and “DU Path” fields must be hidden, for which, the field must be selected with the right click and deselect the “Show Header” option.
Adjust colors and formats.
Initially, the Drill Up menu will only show the first menu option, the rest of the options will appear one by one, as the Drill Down is applied to the hierarchy when using the Parameter Actions.
DEFINITION OF THE MAIN GRAPHICS
PASO 7. DEFINITION OF THE MAIN GRAPHICS.
The main graphics that I used, come from a set of graphics included in one of the great templates that Andy Kriebel recently shared and so I took advantage of the work done in its design on the one hand and, on the other hand, I took advantage of the calculations made in the annual comparisons. The template can be viewed here.
The four KPI sheets defined in the template allow us to view monthly sales, utility, number of orders and customers for the year 2019. These 4 sheets are the ones I incorporated into the final design of my exercise.
But it’s also perfectly valid, that you define your own main graphics. These can be as simple as showing the total quantities of 2019 sales or these can be as elaborate as you want to implement this technique.
To synchronize the level of Drill Down and Drill Up with the main graphs, the filter of “DD Filter” = TRUE must be included
If you, like me, used the 4 KPI graphics of the template, you need to define the filter as context, so that the calculations of the KPI graphics are correctly performed.
However, if you defined your own graphic, make sure that in addition to using the “DD Filter” filter, also use the filter that corresponds to the year of 2019.
CREATE THE DASHBOARD
STEP 8. A dashboard is created that integrates the menu sheet for the Drill Down, the menu sheet for the Drill Up and the main graphics.
DEFINITION OF PARAMETER ACTIONS
STEP 9. DEFINITION OF PARAMETER ACTIONS.
For the dashboard created in the previous step, the following Parameter Actions will be defined for:
The Drill Down the left menu.
| PARAMETER ACTION | SOURCE | TARGET PARAMETER | FIELD OR VALUE | AGGREGATION |
| DD Level | Left Menu | Level | DD Level | Average |
| DD Path | Left Menu | Path | DD Path | None |
The Drill Up the top menu.
| PARAMETER ACTION | SOURCE | TARGET PARAMETER | FIELD OR VALUE | AGGREGATION |
| DU Level | Top Menu | Level | DU Level | Average |
| DU Path | Top Menu | Path | DU Path | None |
To understand more about how the Drill Down and Drill Up menus work, then I share an image with the value of the three main variables involved, when the last user selection was the New York State.
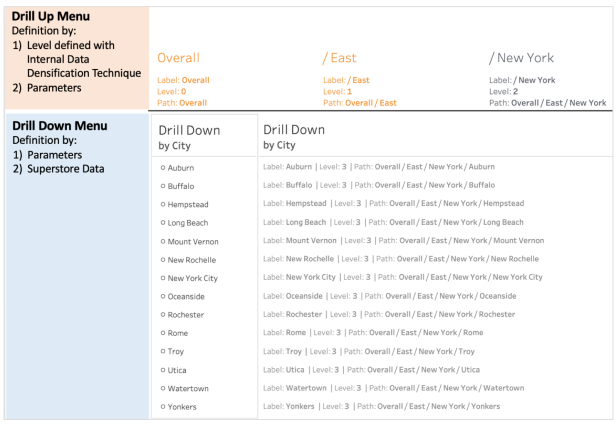
The image also shows how the definitions of both menus start from different sources.
Ready!
The interactive version can be view here.

SUMMARY
In this blog we work with a new technique that allows us to handle Drill Down and Drill Up with a lower number of parameters and that Drill Up options can be shown on a single sheet.
For the definition of the Drill Up menu options, we use the Internal Data Densification technique, which, as we have seen in previous examples, I consider it ideal for the definition of menus where the options are not defined in the data source.
In this exercise, we were able to exemplify how the definition of the menu with the Internal Data Densification technique can be as dynamic as required, since the amount of options to be presented, as well as the legends to be used in the menu are not static, since they are the result of the previous selections of the user.
The procedure used in this exercise can also be used for graphs where the Drill Down is applied directly in the main graph, for which, only small adjustments in some of the formulas will be required. You can view the following two examples:
An adjustment in the formulas for these examples was that I removed the last level of the Drill-Down, since when the Drill Down was immersed in the main graph, the last level didn’t offer additional information, unless the graph is related to other graphs on the dashboard, which was not the case in these examples.
I would like to thank Andy Kriebel for the great templates he recently shared with us, since by using them they facilitate our work by taking advantage of the design and definition of the calculations necessary for the construction of the main graphs.
I also wish to thank for wise feedback along the way to Ann Jackson, Klaus Schulte and Luke Stanke.
Thank you very much and if you have any questions about the post, do not hesitate to contact me on Twitter (@rosariogaunag).

I am new to Tableau and have been trying to leverage your dashboards to learn drill down using your parameter actions.
I tries to create a dashboard with Region on cols and Category on Rows with Profit as measure. I wanted to drill down on category if user clicks on rows, drill down on region when user click on cols and drill down on both when user clicks on their intersection cell.
But what is happening instead is, drill down happens simultaneously on Category and region irrespective of where user clicks.
Is there a way to detect whether user clicked on Category dimension or region dimension and set only those parameters.
LikeLike
Hi Sandeep
The method that I know to distinguish if I select the row or the complete column requires that it have more than one mark, but in the case of going deeper into the drill down it is normal to be left with a single mark and with this technique no longer it could differentiate if you select the entire row or column or just a mark.
What I suggest is to create three sheets, one to show the Categories and another to show the Regions and the last table would be the crosstab where the Categories and Regions are joined, so you can clearly distinguish what is being selected. To do this you have to apply the Pagination technique to show “x” number of rows and “y” number of columns and synchronize the movements of the three sheets.
If you want to know the pagination technique, I recommend that you watch the #WOW challenge this week (week 40)
Best,
Rosario
LikeLike
Hello,
I have been using this method to drill down 9 levels of data and eventually get to 12 levels. I know in your Set Actions blog there’s a way to start from different levels and start drilling from there using filters. I have tried to implement using a separate parameter than the level parameter, but I am having no luck. Do you have suggestions for how I could have a user start at level 5 and drill down from there? I would like a user to input level 5 and tableau would show all values for level 5 and then when the user clicks on the level 5 field they are interested in the path calculation would tell tableau what data to show from there.
Thank you for any help!
Kimmy
LikeLike
Hi Kimmy! Can you send me a message on twitter (@RosarioGaunaG) and thus have a little more context in what you are looking for? Or if you prefer, send me an email.
LikeLike
Hi Rosario – thank you so much for getting back to me! What is the best email to reach you at? It won’t let me message you on twitter and I think the character count may prevent me from providing more context!
LikeLike
Hi Kimmy!! You can send me an email to rgauna@tec.mx
LikeLike
The workbook with the example of selecting the starting level is now downloadable, I hope it can be useful
https://public.tableau.com/app/profile/rgauna/viz/8DrillDownUpSelectingLeveltoStartwithintheHierarchy/DrillDownUp
LikeLike
Hi Rosario,
Thank you for sharing this drill down option. Is this method be used if we want Region in one column and State in another column. If we drill State, we can go till zip code. The first column can also be drilled down and would be depended on the second one (to what extend it can be expanded).
LikeLike
Hi Schywalker
The idea is to only require two sheets: 1) One for the Drill Down menu and 2) Another for the Drill Up menu. In these two menus the different levels of the hierarchy are shown depending on the last element selected.
In general, it is a technique that I do not see a limit on the number of levels to handle, since the formulas only require small adjustments to adapt to the level you require. I take this opportunity to invite you to wait for the publication of a series of blogs that I will publish and I think that one of the examples that I will present may interest you.
LikeLike