
by Klaus Schulte & Rosario Gauna
Some weeks ago, Rosario published a blog where she presented a technique to both drill-down and drill-up a view as a single sheet solution using the Internal Data Densification technique for the drill-up. With this solution, drill-down in combination with drill-up dashboards have become really suitable for everyday dashboards.
Multiple Drill-Downs/Drill-Ups
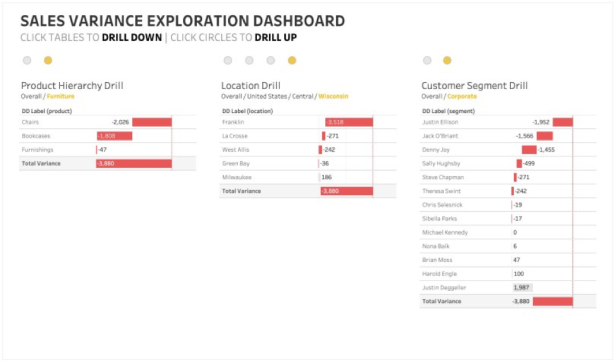
In this blog, we would like to share a solution where we used multiple drill-down/drill-up combinations on one dashboard for an explorative analysis.
Being able to analyze sales (or other) variances is a typical requirement in finance departments. Finance people want to know for example which subsidiary, which product category, with customer segment or with region accounts for which part of the total variance.
In our example we’ve included 10 different dimensions in three separate drill-down/drill-up hierarchies drawing on the example of Tableau’s sample superstore. The conventional way would be to create a view and to put these 10 dimensions on the filter shelf and offer them to the dashboard user as quick filters to find her or his path through the analysis. This comes with the drawback to run into out filtered dashboards or a slow dashboard performance when showing relevant values only. Running into dead ends can also occur when using filter actions.
Our example gets by without any filter but still is very intuitive to use. You just click an element in one of the three tables to drill down and all three tables update according to the new drill level. Click through the drill hierarchy to start over again or use the drill-up circles indicating the current or higher levels.
How to Do it
The steps to create the drill-down and drill-up sheets are perfectly described in Rosario’s blog. We won’t repeat them in this blog, but will point out where we’ve made little changes.
Defining the Hierarchies
For our dashboard, we defined three separate hierarchies:
 Product Hierarchy

Location Hierarchy
 Segment Hierarchy
For all three hierarchies we also had to define separate parameters ‘level’ and ‘path’ and calculated fields for Level, Path and Filter. In this example we omit the fields for title and subtitle and used the path parameter in the title of each view instead.
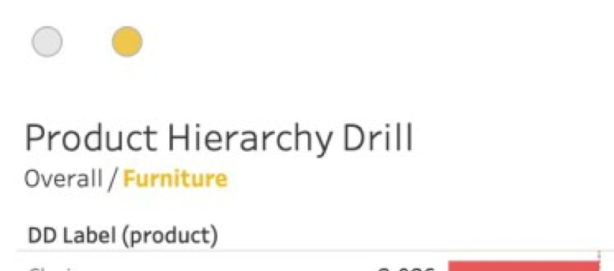
Merging the Drill-Down Menu and the Main Chart
Like Rosario suggested in her post, we merged the drill-down menu and the main chart in this example.
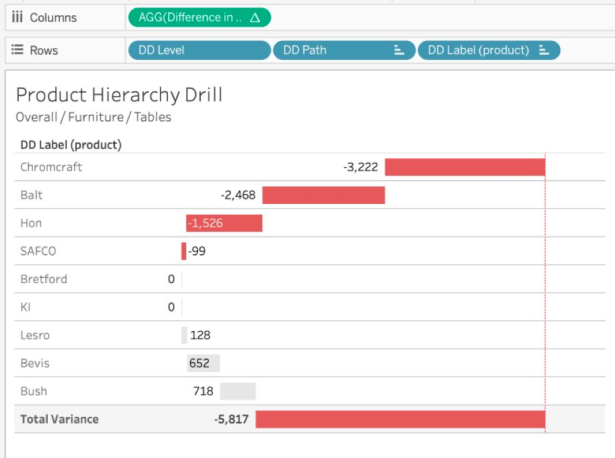
The main chart is a tabular waterfall chart, where the total variance is broken down to the members of the current hierarchy level.
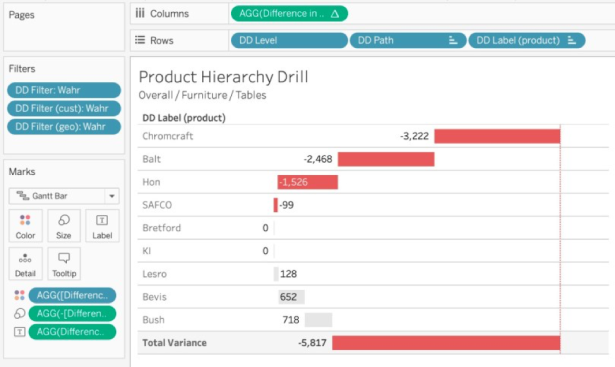
Synchronizing the Views
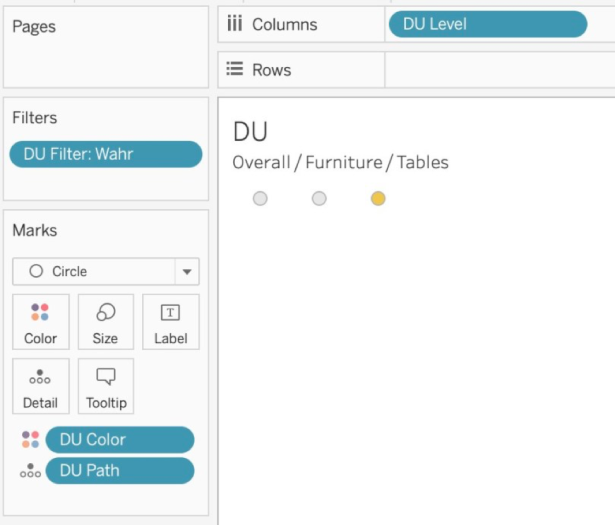
To synchronize the three views, we applied all three drill-down filters on all three sheets. All DD Filters have to be ‘true’ (=’Wahr’).
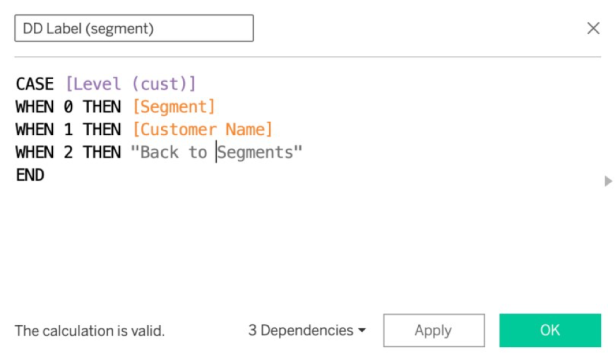
Symplifiying the Drill-Up Menu
The fields Level, Path, Color and Filter had to be defined again for all three hierarchies separately. We simplified the drill-up menu by just showing grey circles and a yellow circle for the current level.
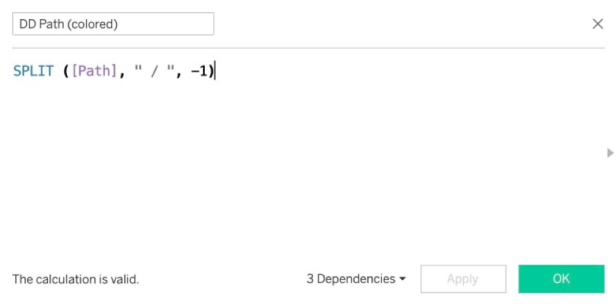
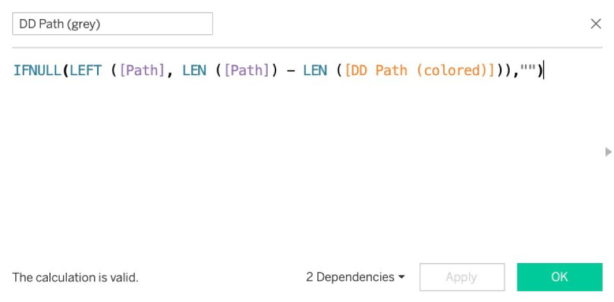
Multiple Colors for the Path
To color the current level of our hierarchies, we’ve split the path into two field by using these formulas and used them in the title.
Setting the Parameter Actions
Last step was to define the parameter actions for all three hierarchies.

That’s it.
We hope you enjoyed reading and find own use cases for this. Find & download the workbook on Tableau Public here.
If you have any questions, reach out to us on Twitter (@ProfDrKSchulte & @rosariogaunag)!
Rosario & Klaus
