Update 02/27/2020: A new blog with a new technique to use Drill Down and Drill Up with Parameter Actions was published with the name “Drill Down with left menu and Drill Up with top menu“.
When Tableau 2019.2 was launched, I soon found myself testing the new functionality of Parameter Actions, to learn more about its use and its benefits.
In the first Drill Down tests, I used examples that involved 3 or more levels of Drill Down and the logic that followed was scalable, regardless of the number of levels. But when I did a test that involved only two levels, the formulas I was using required some adjustments.
For this test, I was inspired by a previous challenge of @LukeStanke, seen during the first week of the year: “Drill Down in Sales”.
And taking advantage of the fact that I was already in stages of tests and learning, along the way I was integrating some additional requirements to the original challenge, which I hope you find interesting.
The main requirements for the challenge are:
- The size of the board is 800 px wide by 600 px high.
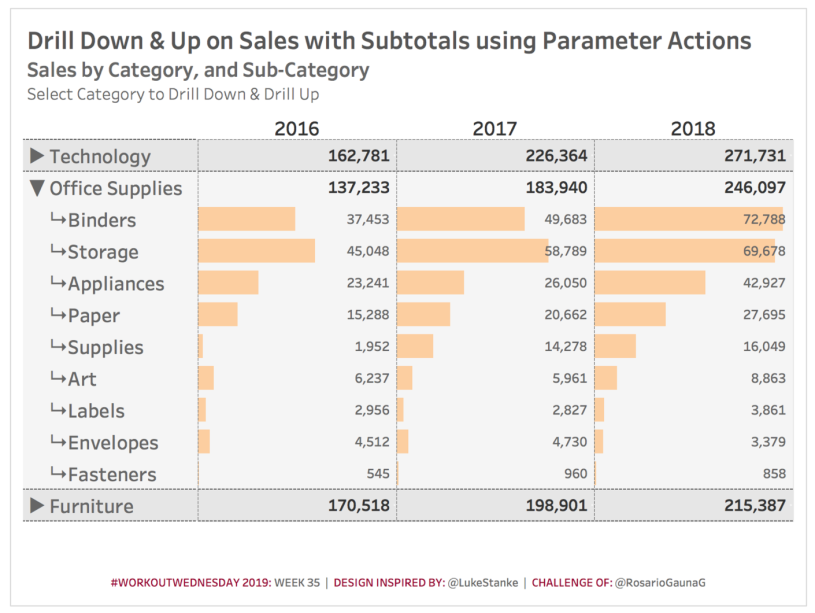
- The initial view should show sales by Category for the last 3 years, in bar chart.
- The new Parameter Actions functionality must be used to apply Drill Down & Drill Up on sales:
- When clicking on a new Category, a Drill Down by Sub-Category is applied:
- Sales by Sub-Category should be shown on a bar chart below it.
- The name of the Sub-Category must be preceded by the following string ” ↳”.
- The total amounts of sales of each of the Categories must be shown as text.
- When clicking on the previously selected Category or clicking on any of the Sub-Categories, a Drill Up is applied.
- When clicking on a new Category, a Drill Down by Sub-Category is applied:
- The original view of the chart will be restored, that is, sales by Category will be displayed on a bar chart.
- Use the right arrow “►” and the down arrow “▼” to indicate when the details are displayed.
- The information must be ordered in descending order by the amount of sales of the last year.
- Match the edges of the rows and the shading of the rows to highlight values.
- Jedi Level: It shouldn’t involve duplicating the data.
Next, I share the steps I used for the Jedi version, that is, the one that implies that “You should not duplicate the data” to get a Drill Down query on Sales.
To achieve this, I know at least two possible options to achieve it.
One of the options is to use the Automatic Sub-Totals option of the Analysis menu.
And the second option, which I chose, is to SIMULATE that we are working with duplicate data, by creating a new dimension with two possible values.
Step 1: Create a parameter to save the last value of the selected “Category”. And another to save the “Level” of the last mark selected.
As we’re going to use the new #Parameter Actions functionality, the first thing we should do is create the parameters.
The first parameter will be called “DD Category Parameter” of type string and its initial assigned value must be an empty string. It will be used to save the value of the last selected Category.
The second parameter will be called “Previous Level Parameter” of integer type and its initial assigned value must be a 2. It will be used to save the value of the last selected Level.
Step 2: Create an annual custome date from the order date field.
For which you have to select with the right click the field of “Order Date” and select the option of “Create -> Custome Date -> Detail: Years”.
The new field will automatically be referred to as “Order Date (Years)”
Step 3: Create a dimension with two values to SIMULATE to have two copies of the data.
The trick is to generate the new variable with only two possible values based on another existing dimension, in this case the new variable is derived from the “Order Date” day.
- For the even days the new variable is given the value of One.
- It will be used for when you want to display information by Category.
- For odd days the new variable is given the value of Two.
- It will be used for when you want to display information by Sub-Category.
| Data = (DATEPART(‘day’, [Order Date]) % 2) + 1 |
Convert to dimension the new variable.
Step 4: Create two new variables with the value of annual sales by Category and Sub-Category.
As we aren’t working with a real duplicate copy of the data, but we only simulate it, by dividing the data into two groups: 1) Even Days and 2) Odd Days. So when we take the sales data and use it with the “data” variable from the previous step, it will show you the sales data of the odd days or odd days, but not the total sales.
As what is required is to have total sales, we will use LOD calculations to obtain the value of sales at the Category and Sub-Category level, regardless of whether sales are made on an even day or on an odd day.
| Annual Sales by Category =
{FIXED [Category], [Order Date (Years)] : SUM([Sales])} |
| Annual Sales by Sub-Category =
{FIXED [Sub-Category], [Order Date (Years)] : SUM([Sales])} |
Step 5: Create two new variables. The first with the value of the Drill Down Level of each Mark and the second with the maximum value of Drill Down Level active in the chart.
| Max Level =
IIF([Previous Level Parameter] = 1, 2, 1) |
| Level =
IIF([Max Level] = 2 AND [Category] = [DD Category Parameter], 2, 1) |
Convert the two new variables to dimension.
Step 6: Create the variable with the annual sales that will be used in the bar chart.
The amount per Category can be presented in two different ways: 1) When the maximum Level is 1, its value will be shown in bar chart and text and 2) When the maximum Level is 2, its value will be shown Only in text.
In order to control when it’s included in the bar chart and when it isn’t included, the following variable is defined.
| Bar Sales =
IIF([Max Level] = 1, [Annual Sales by Category], IIF([Data] = 2, [Annual Sales by Sub-Category], NULL)) |
Step 7: Create the values that will be used on the “Label” shelf.
As different font size is used, for the amounts by Category vs. Amounts per Sub-Category, it’s required to have two new variables to identify each case.
| Text Size1 =
IIF([Data] = 1, [Annual Sales by Category], NULL) |
| Text Size2 =
IIF([Data] = 2, [Annual Sales by Sub-Category], NULL) |
Step 8: Create two variables to help us get around each of the two levels of Drill Down.
Only data from the last year should be considered for the purpose of ordering.
| Sort1 =
IIF([Data] = 1 AND [Order Date (Years)] = {FIXED : MAX([Order Date (Years)])}, [Annual Sales by Category], NULL) |
| Sort2 =
IIF([Order Date (Years)] = {FIXED : MAX([Order Date (Years)])}, IIF([Data] = 1, [Annual Sales by Category], [Annual Sales by Sub-Category]), NULL) |
Step 9: Create a new dimension where the information will be presented by Category and Sub-Category.
This variable allows the information of both levels of the Drill Down to be displayed in a single column of the report.
| DD Dimension =
IIF([Data] = 1, |
Step 10: Create two new dimensions to filter the data you want to present.
The data of the Categories are always presented and in the case of applying the Drill Down at the Sub-Categories level, those belonging to the Category selected by the user will be displayed.
| Filter Data =
[Data] = 1 OR ([Data] = 2 AND [Max Level] = 2 AND [Category] = [DD Category Parameter]) |
To filter the information of the last 3 years with which data are available.
| Filter Years =
DATEPART(‘year’, [Order Date]) >= {FIXED : MAX(DATEPART(‘year’, [Order Date]))} – 2 |
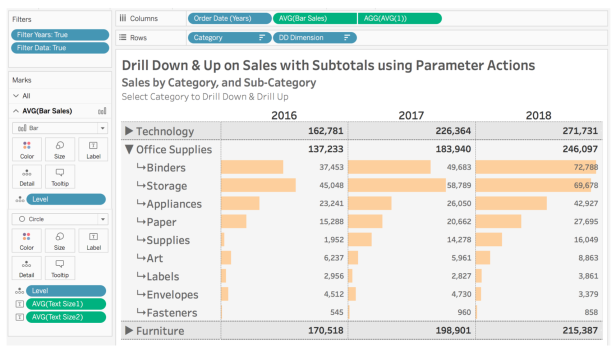
Step 11: Create the bar chart.
A Non-Synchronized Double Axis chart is created: Using a Bar chart with a circle chart.
Filter by the fields “Filter Data” = True and “Filter Years” = True
For the axis of the Bars move to the shelves of:
- Columns ⬅ “Order Dates (Years)” discrete value and “AVG(Bar Sales)”
- Rows ⬅ “Category” Hide Header
- Rows ⬅ “DD Dimension”
- Detail ⬅“Level”
For the axis of the circle chart
- Columns ⬅ “AVG(1)”
- Label ⬅“AVG([Text Size1])”
- Label ⬅“AVG([Text Size2])”
- Size ⬅Fit to the smallest possible size.
- Color ⬅No Border and Opacity 0%
Apply a Non-Synchronized Double axis in the chart.
 Sort the fields of “Category” and “DD Dimension”.
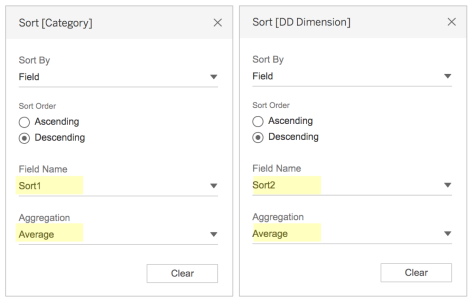
Edit the AVG axis Label (1), to format the fields:
- Text Size1: Tableau SemiBold 12.
- Text Size2: Tableau Medium 10.
STEPS TO DEFINE PARAMETER ACTIONS
Create a dashboard that includes the newly created chart.
Create two Parameter Actions using the “Change Parameter” option of the “Actions” menu, within the newly created dashboard menu.
| PARAMETER ACTION | TARGET PARAMETER | FIELD OR VALUE | AGGREGATION |
| Category Parameter Action | DD Category Parameter | Category | None |
| Level Parameter Action | Previous Level Parameter | Label | Average |
Set the format and ready, let’s test the operation of the #Parameter Actions!
My solution is available here.

In conclusion:
In this exercise, we use the Parameter Actions to perform Drill Down with Subtotals within the same sheet.
To show the subtotals without duplicating the data, the logic of this exercise requires the simulation of working with two copies of the data, but in reality, what we do is separate the data into two groups (even days to show data by Category and odd days to display data by Sub-Categories), therefore, the use of LOD calculations is required to present total sales amounts, regardless of the data group being worked on.
The final result is a Viz where the two Drill Down variables (Category and Sub-Category), harmoniously coexist in a single column, taking advantage of the space within the Viz.
In addition there is another additional advantage, since with this technique we control that the Drill Down & Drill Up are accessible to just one click. In the Set Actions upon reaching the last level it is required to click twice to return to the first level of the data. And when working with only two levels of Drill Down, saving on clicks provides an additional advantage to the end user.
Thank you very much and if you have any questions about the post, don’t hesitate to contact me on Twitter (@rosariogaunag).
Regards!
Rosario Gauna

Thanks for this drill down with subtotals and the new ones (Drill up menu at the top) using the Parameters. These are fabulous for financial data.
I have a 9 levels business hierarchy and 9 level Geography hierarchy. I am able to replicate the drill down with top menu drill up but not this asymmetric one with subtotals.
Have you done an similar example of asymmetric drill down with subtotals or any other drill down with subtotals.
Thanks a ton for sharing so many useful worksheets they are extremely useful.
LikeLike
That’s great to hear Sandeep!
I have worked with financial data for a long time and I am happy to hear that the examples are useful to you.
From what I understand, you need to manage more than one hierarchy at a time, maybe my blog Exploration Dashboards with Multiple Drill-Downs in Tableau (bit.ly/2LSiwIX) will help you and if not, could you share an example of what you seek.
LikeLike