
Update 02/27/2020: A new blog with a new technique to use Drill Down and Drill Up with Parameter Actions was published with the name “Drill Down with left menu and Drill Up with top menu“.
With the new functionality of #ParameterActions, interactions with a visualization became more powerful, since it allows users to modify the value of a parameter through direct interaction with a visualization, such as clicking or selecting a “mark”. ”
Among the multiple possibilities offered by the use of #ParameterActions, I am continuing with this blog, deepening its use in different techniques of Drill Down, since I believe that in addition to facilitating the definition of complex Drill Down, it also speeds up the response time when interacting with the visualization.
The objective of this exercise is to take advantage of the benefits of Parameter Actions in an Asymmetrical Drill Down, for which we will use one of the famous designs for Set Actions, created by the incredible Lindsey Poulter.
Link to Lindsey Poulter’s Dashboard.
Requirements:
- The new functionality of Parameter Actions must be used for Drill Down.
- Definition of three levels of Drill Down hierarchy for sales: Category, Subcategory and Region.
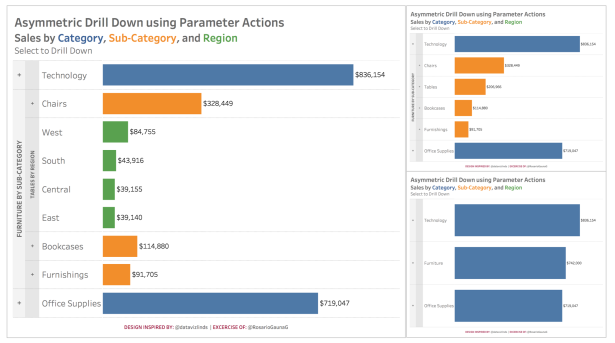
- Initially, the information must be displayed at the Categories level.
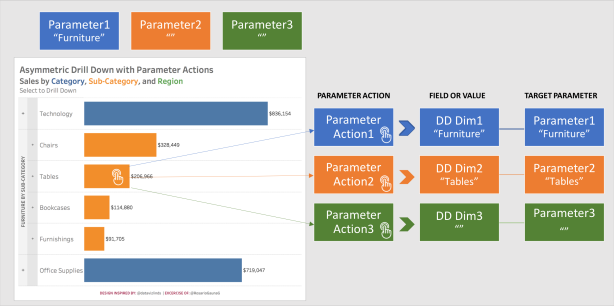
- When the user selects a Category mark, the chart will be updated and only for the selected Category the details will be displayed by Subcategory, the rest of the Categories marks will show total amounts, that is, they will remain unchanged.
- When the user selects a subcategory mark, the chart will be updated and only for the selected subcategory the details will be displayed by region, the rest of the marks will remain unchanged.
- When the user selects a Region mark, the chart will return to its original condition and display the information at the Category level.
Below I share the steps I used in this new version of Asymmetric Drill Down using #ParameterActions:
Step 1: Create a string type parameter for each level of Drill Down (Three Levels – Three Parameters).
As the new functionality of #ParameterActions is going to be used, the first thing we have to do is create the parameters.
A parameter must be created for each different value that you want to identify when the user interacts directly with the visualization, that is, one for each level of the hierarchy. In this case: One for Category, another for Sub-Category and one last for the Region.
The initial value assigned must be an empty string “”.
The parameters will be named: “DD Parameter1”, “DD Parameter2” and “DD Parameter3”, to identify the three levels of the hierarchy, that is, Category, Sub-Category and Region respectively.

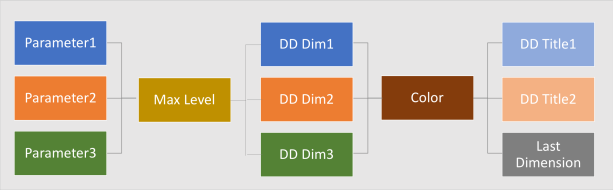
Step 2: Calculate a new dimension with the value of the maximum level of Drill Down.
Initially, the values of the three parameters are equal to the value of an empty string “” and therefore the level to start is 1.
Later, when the #ParameterActions are defined and the user begins to interact directly with the visualization, the values of each of the three parameters will be updated according to the mark selected by the user.
With the update of the values of the three parameters, automatically the value of this field will be recalculated and its value will be changing between 1, 2 and 3.
| Max Level =
IIF([DD Parameter1] = “” OR [DD Parameter3] <> “”, 1, IIF([DD Parameter2] = “”, 2, 3)) |
Step 3: Create a new dimension for each level of Drill Down.
A variable is created for each level of the hierarchy: Category, Sub-Category and Region. Its value will depend on the level of consultation that is being carried out.
These variables are affected by the action of the user on the chart and, in turn, when the #ParameterAction is activated, they serve to update the value of the associated parameter.
| DD Dim1 =
[Category] |
| DD Dim2 =
IIF([Max Level] >= 2 AND [DD Dim1] = [DD Parameter1], [Sub-Category], “”) |
| DD Dim3 =
IIF([Max Level] >= 3 AND [DD Dim2] = [DD Parameter2], [Region], “”) |
Note: The “DD Dim1” dimension is optional, but I preferred to include its calculation, due to the standardization of names in the formulas.
When the level of hierarchy two is independent of level one, it is required to add an additional condition for the calculation of “DD Dim3”.
| DD Dim3 =
IIF([Max Level] >= 3 AND [DD Dim1] = [DD Parameter1] AND [DD Dim2] = [DD Parameter2], [Region], “”) |
In this exercise I used the simplified formula, since each Sub-Category depends on a single Category.
Step 4: Calculate the dimension of “Color”.
The color of each bar or “mark” will depend on the level of Drill Down of each “mark.
| Color =
IIF([DD Dim3] <> “”, 3, IIF([DD Dim2] <> “”, 2, 1)) |
Paso 5: Calcular una nueva dimensión con el nombre que representa cada barra, de acuerdo al nivel de Drill Down.
The name that will be displayed just to the left of each “mark” (third visible column), will also depend on the level of Drill Down of each “mark”
| Last Dimension =
CASE [Color] WHEN 1 THEN [DD Dim1] WHEN 2 THEN [DD Dim2] WHEN 3 THEN [DD Dim3] END |
Step 6: Create two new dimensions of text, to help the user understand which Categories and Sub-Categories have been selected.
The text that will be displayed in the first and the second shaded columns that appear to the left of each “mark”, which will also depend on the level of Drill Down of each “mark”.
| DD Title1 =
IIF([Color] > 1 , UPPER([DD Dim1]) + ” BY SUB-CATEGORY”, “+”) |
| DD Title2 =
CASE [Color] WHEN 1 THEN “” WHEN 2 THEN “+” WHEN 3 THEN UPPER([DD Dim2]) + ” BY REGION” END |
Step 7: Create the bar chart
Move to the shelves of:
- Columns ⬅ “Sales”
- Rows ⬅ “DD Dim” sorted by sales and hide header
“DD Title1”
“DD Dim2” sorted descendingly by sales and hide header
“DD Title2”
“DD Dim3″ sorted descendingly by sales and hide header
“Last Dimension”
- Color ⬅ Color
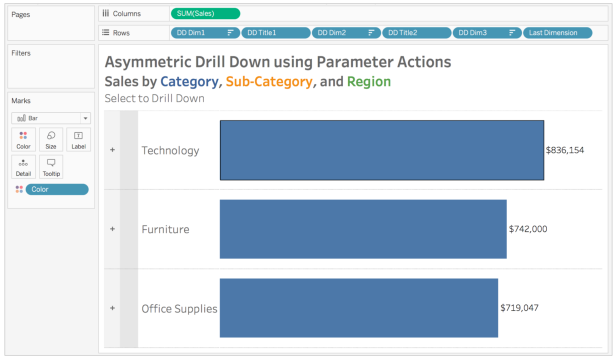
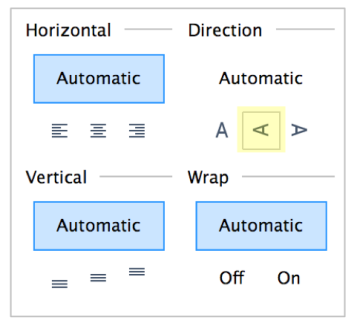
Adjust the format of fields “DD Title1” and “DD Title2” of the row shelf: Set different shades, adjust the width of columns and modify the direction of text display.
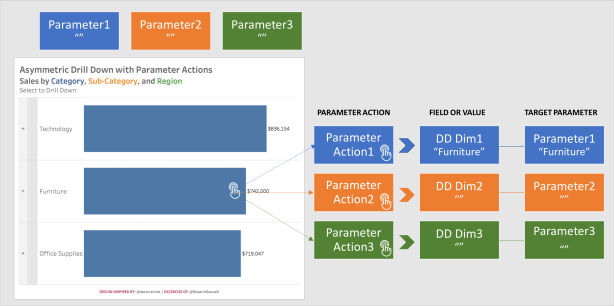
CREATE THE PARAMETER ACTIONS
Create a dashboard that includes the newly created chart.
Create a #ParameterActions for each level of Drill Down “Category – Sub-Category and Region” (Three Levels – Three # ParameterActions).
To define them, use the “Change Parameter” option in the “Actions” menu, within the newly created dashboard menu.
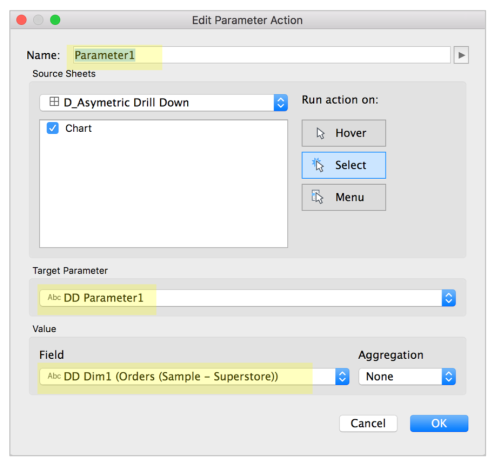
| PARAMETER ACTION | TARGET PARAMETER | FIELD OR VALUE |
| Parameter1 | DD Parameter1 | DD Dim1 |
| Parameter2 | DD Parameter2 | DD Dim2 |
| Parameter3 | DD Parameter3 | DD Dim3 |
Ready, let’s try the operation of #ParameterActions!
In summary:
In this exercise, #ParameterActions are used to perform Asymmetric Drill Down within a single sheet.
The logic of this exercise requires for each level of hierarchy, the definition of:
- A string type parameter.
- A Parameter Action.
- A Dynamic Dimension to update the value of the associated parameter, when the #ParameterAction is activated.
Each time a “mark” of the visualization is selected, the #ParameterActions are activated.
Each of the #ParameterActions must update the value of its associated parameter, according to a dimension.
Once all the parameters have been updated, the calculated fields that depend on the value of the parameters will be updated.
With the new values, the Visualization will in turn be updated.
Once, that another “mark” is selected, the update cycle is restarted.
Thank you very much and if you have any questions about the post, do not hesitate to contact me on Twitter (@rosariogaunag)
Regards!
Rosario Gauna

Hi Rosario,
Many thanks for your post!
I was wondering what you should adjust in the calculations if you want to create this view with 4 dimensions. Could you help me with this?
Kind regards,
Alexander
LikeLike
Hi, Alexander, I hope very soon to share an example with a greater number of levels. Regards!
LikeLike
Hi, Alexander! I share the link to an example with 4 levels.
tabsoft.co/2WmUev8
LikeLike
Hi, Alexander.
I share you link to a new post that I think can also be useful.
It presents 5 levels of hierarchy and uses parameter actions for Drill Down & Up.
The design is different from the one presented in this post, since instead of an asymmetric query, only the last level of the hierarchy is consulted.
bit.ly/2NrvKNa
LikeLike
Hi Alexander! Today I just published a new Drill Down & Drill Up blog with Parameter Actions with a new technique and I think you may be interested bit.ly/3cfqbgi
LikeLike
Thanks Rosario!
LikeLike
Thanks Rosario,
very nice, clear and concise description. Easy to adapt to more layers, if needed. What I prefer most about this version compared to the set version is that it in my opinion is much easier to follow (no need to pay attention to from which dimension you create the sets).
Also, reseting works easier / more user friendly as the SET version requires the user to click twice in either the bar chart or the reset button (since at least from my understanding – maybe i am missing something – the reset only works on the deselection which then triggers the set action and “remove from set”).
Contrary, the parameter reacts immediately to it being cleared.
Finally, it seems to work much (!) faster. I am currently having both versions in my dashboard and when I use the set version apparently, the sets have to be calculated whereas here everything is readily available.
Thanks again, I will replace all my set drilldowns with this one.
Steffen
LikeLike
That’s great to hear Steffen! I’m glad to hear that the blog has been useful to you.
I agree with you that the Parameter Actions are ideal for Drill Down exercises. The advantage is that we have both Set Actions and Parameter Actions and we can choose the one that best suits what you are looking for.
Today I just published a new Drill Down & Drill Up blog with Parameter Actions with a new technique and I think you may be interested bit.ly/3cfqbgi
LikeLiked by 1 person
Thanks for the tutorial. When I’m doing it for work, the sorting is misaligning. Somtimes the item I click opens and then moves to the top and other times it doesn’t. Have you seen this happen? What has worked for you?
LikeLike
Hi Raj!
The columns DD Dim1, DD Dim 2 and DD Dim 3 are the ones that help us to sort. Although they are present in the visualization, they are hidden so as not to make them visible to users.
You must intersperse the columns to be able to sort by sales, with the columns that are to be viewed by the end user.
That is, arrange in the following order: DD Dim1, DD Title1, DD Dim2, DD Title2, DD Dim3, DD Title3.
Hope this solves your problem, if not, could you share an example on Tableau Public?
LikeLike