
Welcome to the second blog in a series dedicated to sharing five exercises focused on creating menus designed for the selection of elements within a hierarchy. This time, we will focus on building a multiple selection filter in a two-level hierarchy. The specific exercise will consist of developing a menu that allows the selection of one or several months of the year 2023, and even the entire year.
Although in previous blogs, I have explored techniques that provide similar multiple selection functionality, as detailed in the posts titled ‘Multiple Selection of Values for Hierarchies‘ and ‘Expand and Collapse Menu Functionality + Multiple Selection of Values for Hierarchies‘ functionality, It should be remembered that in the previously presented techniques, prior preparation of the data was required, since for its operation it was necessary to previously number the child nodes of the hierarchical tree.
Now, the technique that will be worked on in this blog offers the benefit of not requiring previously numbering the nodes of the hierarchical tree. The inspiration for the development of this technique came from one of the configuration options traditionally offered in the definition of a filter, which allows the filter to be configured in modes such as ‘Include Values’ or ‘Exclude Values’ during selection. Each option operates as follows:
- Include Values: The choices on the filter card are incorporated into the view.
- Exclude Values: The choices on the filter card are excluded from view.
Although the filter we will build in this example will operate in the ‘Include Values’ configuration, I built the new technique for multiple selection of options to be supported internally by a simulation to include or exclude values depending on whether the ‘All’ option was been previously selected or not. In this way, we will determine whether the elements stored in the main parameter are selected or not.
Now, let’s take a look behind the scenes to understand how this technique works.
In this exercise, we will also apply a technique that I love to use and that I consider to be very useful in multiple situations: ‘Internal Data Densification’. Although the term may sound sophisticated, its application is simple and refers to the technique of creating new data fields from one or more existing fields in the current data source. Let’s get started!
STEP 1. CREATE DATA EXTRACT FOR THE YEAR 2023.
Filter to create the extract by exclusively selecting the ‘Order Date’ data for the year 2023.
STEP 2. DEFINE PARAMETERS.
In addition to the parameter intended to store the menu options, called ‘P.Check’, we will introduce a second parameter called ‘P.Mode’. This new parameter aims to internally simulate whether the options stored in the first parameter should be considered ‘Include Values’ or ‘Exclude Values’ when deciding whether or not said values are selected.
| PARAMETER | TYPE | ALLOWABLE VALUES | CURRENT VALUE |
| P.Mode | Boolean | True/False | True |
| P.Check | String | All | »February, 23»July, 23» |
We will set aliases for the values of the ‘P.Mode’ parameter. For the value ‘True’, the alias will be ‘Included’, while for the value ‘False’ the alias will be ‘Excluded’.
3. DEFINE NEW FIELDS FOR THE MENU.
The first step is to create the label field that will contain the name of the month.
| Month | DATE(DATETRUNC(‘month’, [Order Date])) |
| Month | Text | DATENAME(‘month’, [Month]) + “, ” + RIGHT(STR(YEAR([Month])), 2) |
Next, we will work on the definition of the level field using the internal data densification technique. This method involves generating values (0 and 1) for the new field based on the values of another field. In this example, the definition will state that the value will be 0 for the highest order number and 1 for the rest of the orders.
| Level | IIF([Order ID] = {MAX([Order ID])}, 0, 1) |
Now, we will proceed to define the field that will be used as a filter in the graphs associated with the filtering menu.
| Is Selected? | [IIF(CONTAINS([P.Check], “»” + [Month | Text] + “»”), [P.Mode], NOT [P.Mode]) |
Later, we will address the definition of the menu label fields and the creation of the ‘Shape’ field that will accompany it. The menu field will contain the visible menu label, while the ‘Shape’ field will allow us to see if the option is fully or partially selected or not selected.
| Menu | IIF([Level] = 0, ‘All’, [Month | Text]) |
| Shape | IIF([Level] > 0, IIF([Is Selected?], ‘Checked’, ‘Unchecked’), IIF(NOT {MIN([Is Selected?])} AND {MAX([Is Selected?])}, ‘Partial’, IIF({MAX([Is Selected?])}, ‘Checked’, ‘Unchecked’))) |
Later, we will move towards defining the fields necessary to update both parameters.
| Check? | IIF([Level] > 0, [Is Selected?], {MIN([Is Selected?])}) |
| Next P.Check | IIF([Level] = 0, “»”, IIF(([Check?] AND [P.Mode]) OR (NOT [Check?] AND NOT [P.Mode]), REPLACE([P.Check], “»” + [Month | Text] + “»”, “»”), [P.Check] + [Month | Text] + “»”)) |
| Next P.Mode | IIF([Level] = 0, [Check?], [P.Mode]) |
STEP 4. DEFINE THE FIELDS TO CANCEL THE HIGHLIGHTING WHEN SELECTING ANY OF THE OPTIONS
| HL | TRUE |
| UHL | FALSE |
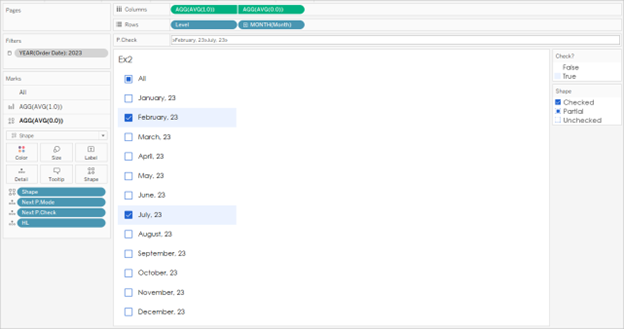
STEP 5. BUILD THE MENU GRAPH.
Create a sheet with the name ‘Ex2’.
Move the ‘Level’ field to the row shelf. Then move the ‘Month’ field to the row shelf, right-click and select the ‘Month’ with year option from the menu. Again, right-click and select the ‘Discrete value’ option from the menu. Then, hide the ‘Header’.
First axis of the graph (Bar):
In the column shelf, enter the formula ‘AVG(1.0) ‘ to define the first axis. Set the axis range between 0 and 1, change the graph type to bars, and hide the axis.
Next, customize the labels and colors: Add the ‘Menu’ field to the ‘Label’ shelf, aligning the labels to the left. Modify the text to add 9 to 10 spaces to the left of the menu field and set the font to ‘Century Gothic’ with a size of 10. Add the ‘Check?’ field. ‘ to the ‘Color’ shelf, using color #ebf2ff for the value ‘TRUE’ and color #ffffff for the value ‘FALSE’.
Additionally, add the ‘HL’ field to the ‘Detail’ shelf and remove all visible lines.

Second axis of the graph (Shape):
To set the second axis, enter the formula ‘AVG(0.02)’ directly into the column shelf. Make sure to indicate double axis synchronization and change the graph type to ‘Shape’. Subsequently, hide both axes.
On the second axis, remove the ‘Menu’ field from the ‘Label’ shelf and remove the ‘Check?’ field. ‘ from the ‘Color’ shelf. Adds the ‘Shape’ field to the ‘Shape’ shelf. Select the images that will be used to indicate whether the option is fully selected, partially selected or not selected.
STEP 6. DEFINE PARAMETER ACTIONS TO UPDATE PARAMETERS.
| PARAMETER ACTION | SOURCE | TARGET PARAMETER | FIELD OR VALUE | AGGREGATION |
| P.Check | Ex2 | P.Check | Next P.Check | None |
| P.Mode | Ex2 | P.Mode | Next P.Mode | None |
STEP 7. DEFINE ACTIONS TO AVOID HIGHLIGHTING.
We will use a filter action to avoid highlighting when selecting one of the ‘marks’.

In this second chapter of our series focused on improving the user experience in managing hierarchies and filters, we have explored an example of multiple selection filtering in a two-level hierarchy. I hope you found the techniques shared useful.
It is crucial to note that, unlike the technique I shared in early 2023, in this new technique it is not necessary to pre-number the nodes of the hierarchical tree, by internally incorporating the concept of ‘Include/Exclude’ values to determine if the values included in the main parameter must be incorporated or excluded when determining whether the value is selected or not.
In future episodes of this series, we will continue to explore more advanced techniques for managing hierarchies and filters. If you are interested in learning about the construction of three-level multiple selection filtering, don’t miss the next chapter in the series.
Any questions or comments about the exercise addressed in this chapter will be more than welcome. Don’t hesitate to get in touch.
See you next chapter!
