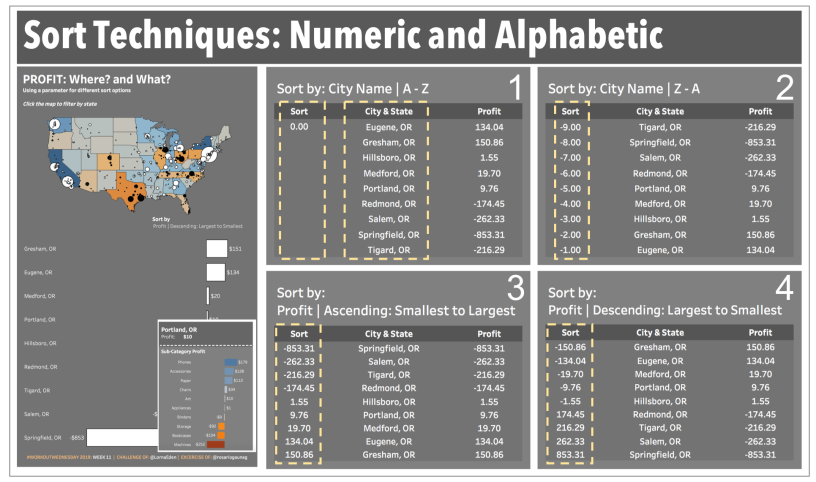
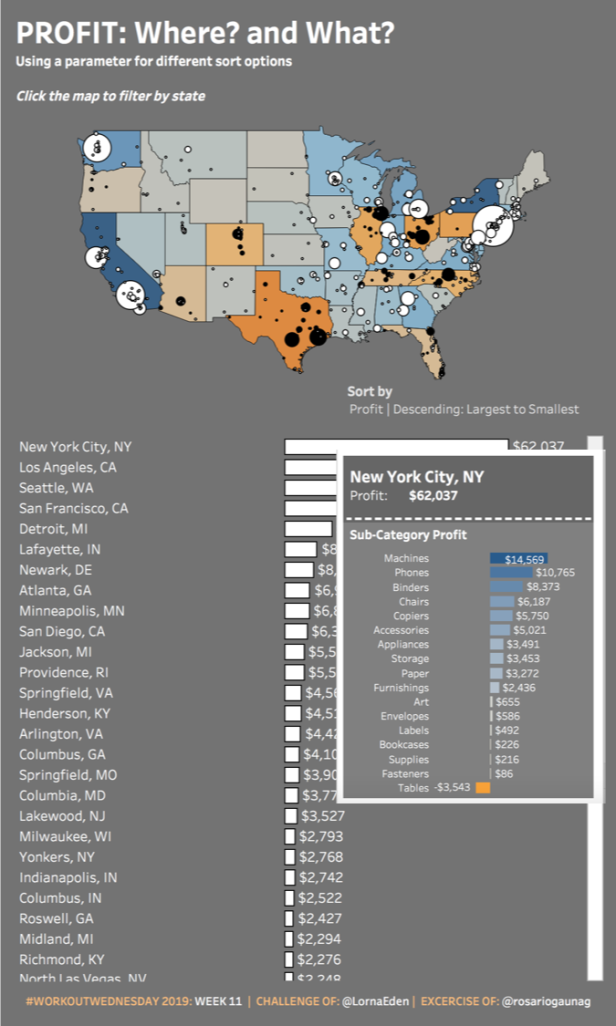
For Week 11 of Workout Wednesday, @LornaEden shares a challenge with multiple hidden tricks and the use of Viz in Tooltips.
Lorna tells us to concentrate on a specific part: Sorting in Tableau, where it’s required to allow the sort of descending or ascending by the name of the city or by the amount of the “Profit”. That is, sort: A – Z, Z – A, Profit Asc and Profit Desc.
Therefore, also in the blog, I will focus on the management of Sorting in Tableau. Next, I share the steps that I followed.
STEPS TO CREATE THE CHART OF BARS AND TO APPLY THE TECHNIQUES OF SORT
Step 1: Calculate the “City & State” field.
A new field is calculated with the name of the city plus the abbreviation of the state. The formula for assigning the abbreviation to each state can be taken directly from the challenge.
| City & State = [City] + “, ” + [Abbreviation] |
Step 2: Define the “Sort by” parameter
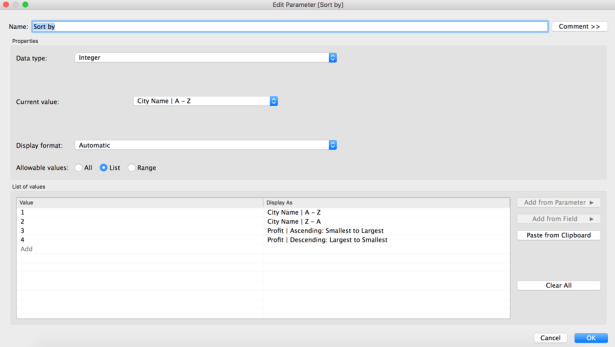
The challenge asks us to order ascending / descending using one of the following two variables: “City & State” or “Profit”.
The parameter will be defined with 4 options: 1) A-Z, 2) Z-A, 3) Profit Asc, 4) Profit Desc
 Step 3: Calculate the variable “Sort”
The ordering requested in the challenge involves using a measure (Profit) and a dimension (“City & State”), that is, we have numbers vs. words.
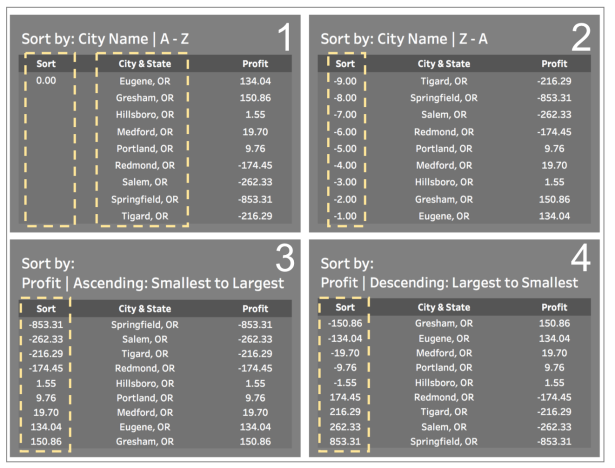
The calculation of the value of “Sort” for the case of using in the numerical field of “Profit” is quite simple, since we only need to adapt the sign of the amount of “Profit” depending on whether we want to order ascending (+) or descending (-)
As for ascending order by the name of the city, that is to say, the “A-Z” does not present any difficulty since it is only necessary to assign the value of zero to the “Sort” field. Why? Because this will give a tie in the value of “Sort” between all the cities and with the tie, the cities will automatically be sorted ascending by their full name.
For the option of descending order by the name of the city, the formula “-Index ()” will be used.
The “Index ()” gives us a consecutive number for each city by sorting them up by name. To achieve the opposite effect, that is, to order them downwards, the negative value of the index will be used.
| Sort =
CASE [Sort by] WHEN 1 THEN 0 WHEN 2 THEN -INDEX() WHEN 3 THEN SUM([Profit]) WHEN 4 THEN -SUM([Profit]) END |
In option one, you can choose to use in the “CASE” the value of zero or the value of the index () with the same results.
Step 5: Create the bar type chart.
Move to the shelves of:
- Text ⬅ “Profit”
- Columns ⬅ “Profit”
- Rows ⬅ “Sort”
- Rows ⬅ “State & City”
The “Sort” field in the row shelf is hidden so that it isn’t shown in the display and the Table (down) option is chosen for the table calculation.
Next, I share an example when choosing the state of Oregon, of the values of the main variables involved, in the four types of ordering.
STEPS TO CREATE THE MAP
Step 6: Create a copy of “Profit”.
This in order to be able to handle two different colors for the Profit: one for filling the states on the map and a second color for the circles of each city.
| Color for Circles = Profit |
Step 7: Create the map chart with double axis.
With the following specifications:
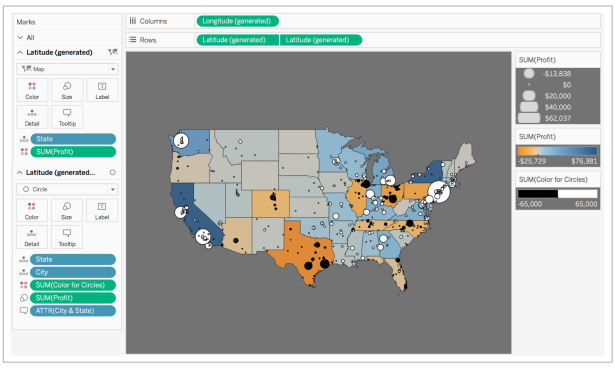 Edit the card the size of the circles and select Size vary: from zero
Edit the color card and capture in Stepped color the number two, in order to manage only two colors: White for positive utilities and black for negative utilities.
Add formats and tooltips.
Ready!
 If you have any questions about the blog, do not hesitate to contact me on Twitter (@rosariogaunag)
Regards!
Rosario Gauna
